Meetings start with a search for figures
Hours are in one spreadsheet, absence in another and course participation somewhere else. Before you can discuss anything, you have to bring it all together.

Does this sound familiar?
A useful overview goes beyond a total. You want to know where the figures come from, who needs to act and what to look for next time.
Hours are in one spreadsheet, absence in another and course participation somewhere else. Before you can discuss anything, you have to bring it all together.
Which period does this cover? Have the hours been approved? Who still needs to finish their training? Without the underlying detail, you are left guessing.
The report has been discussed, but day-to-day follow-up happens elsewhere. By the next meeting, the information needs gathering all over again.
1. Check working hours
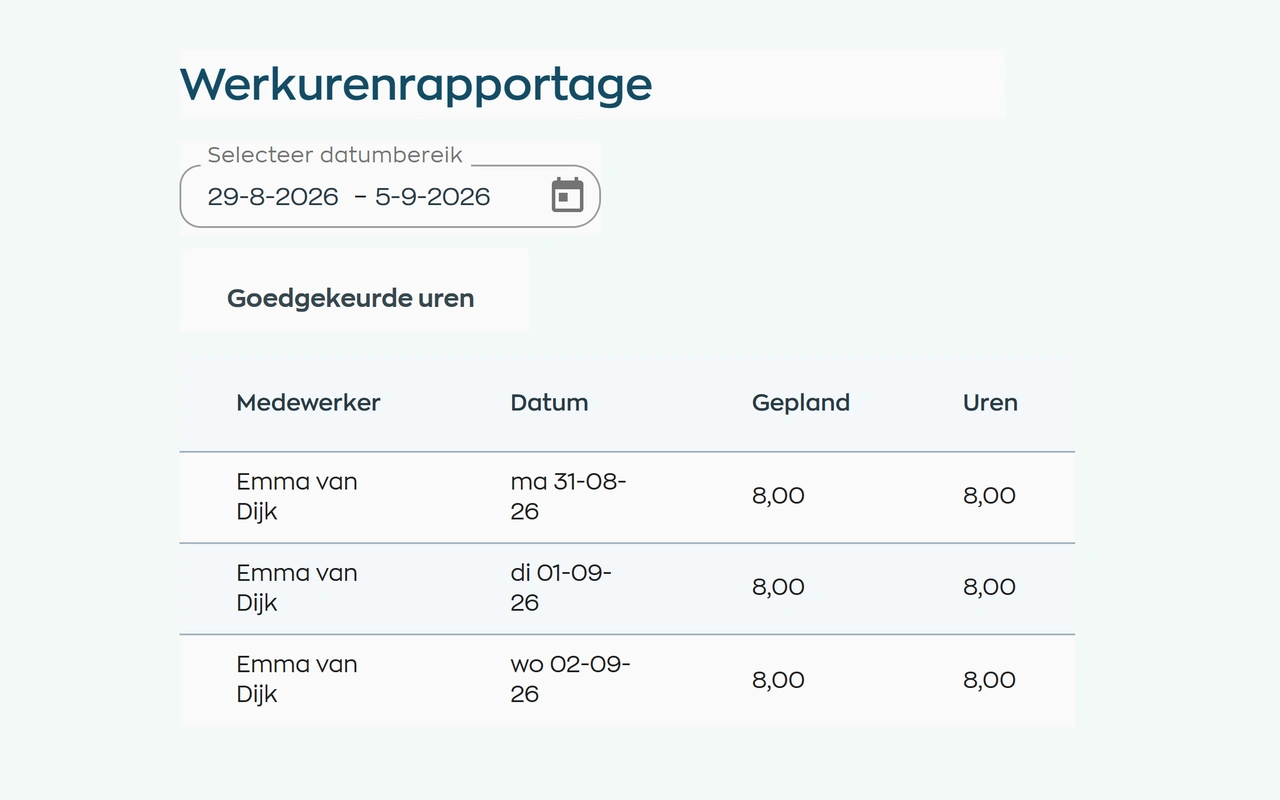
HR or an administrator selects the period and the relevant team or employees. Compare scheduled, recorded and approved hours, and see who approved the final entries. This gives everyone the same basis for discussing differences.
Review records and summaries by employee, work schedule or location. Include leave, absence and overtime, and export the hours report to Excel for further processing. The responsible manager still approves hours in Time Tracking.
2. Understand absence
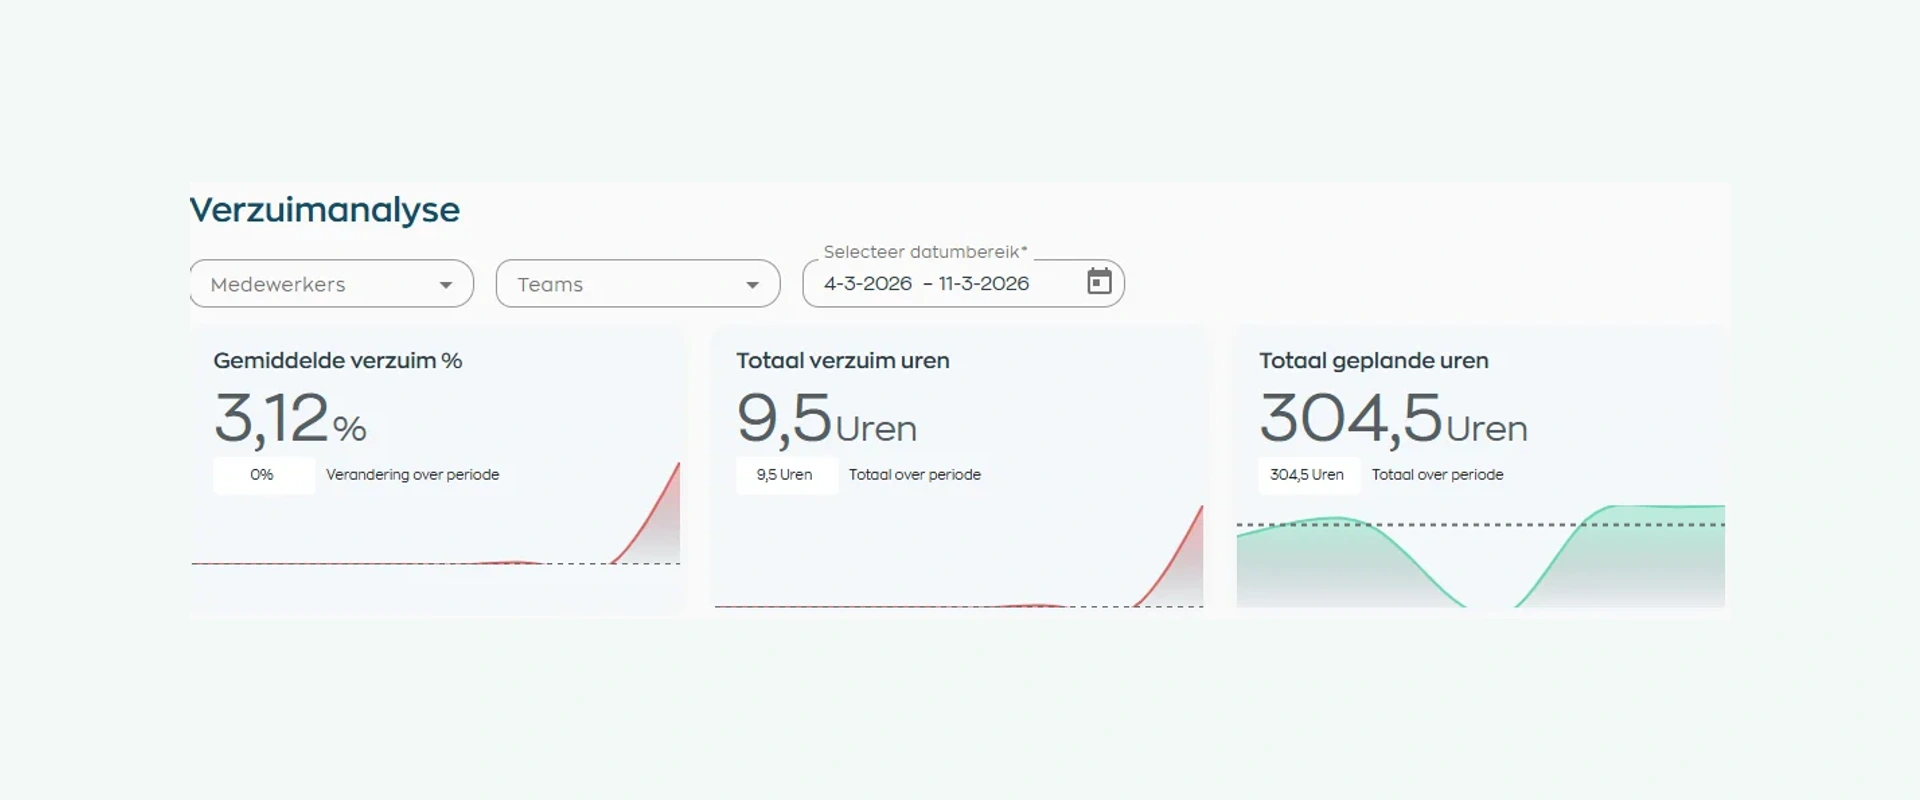
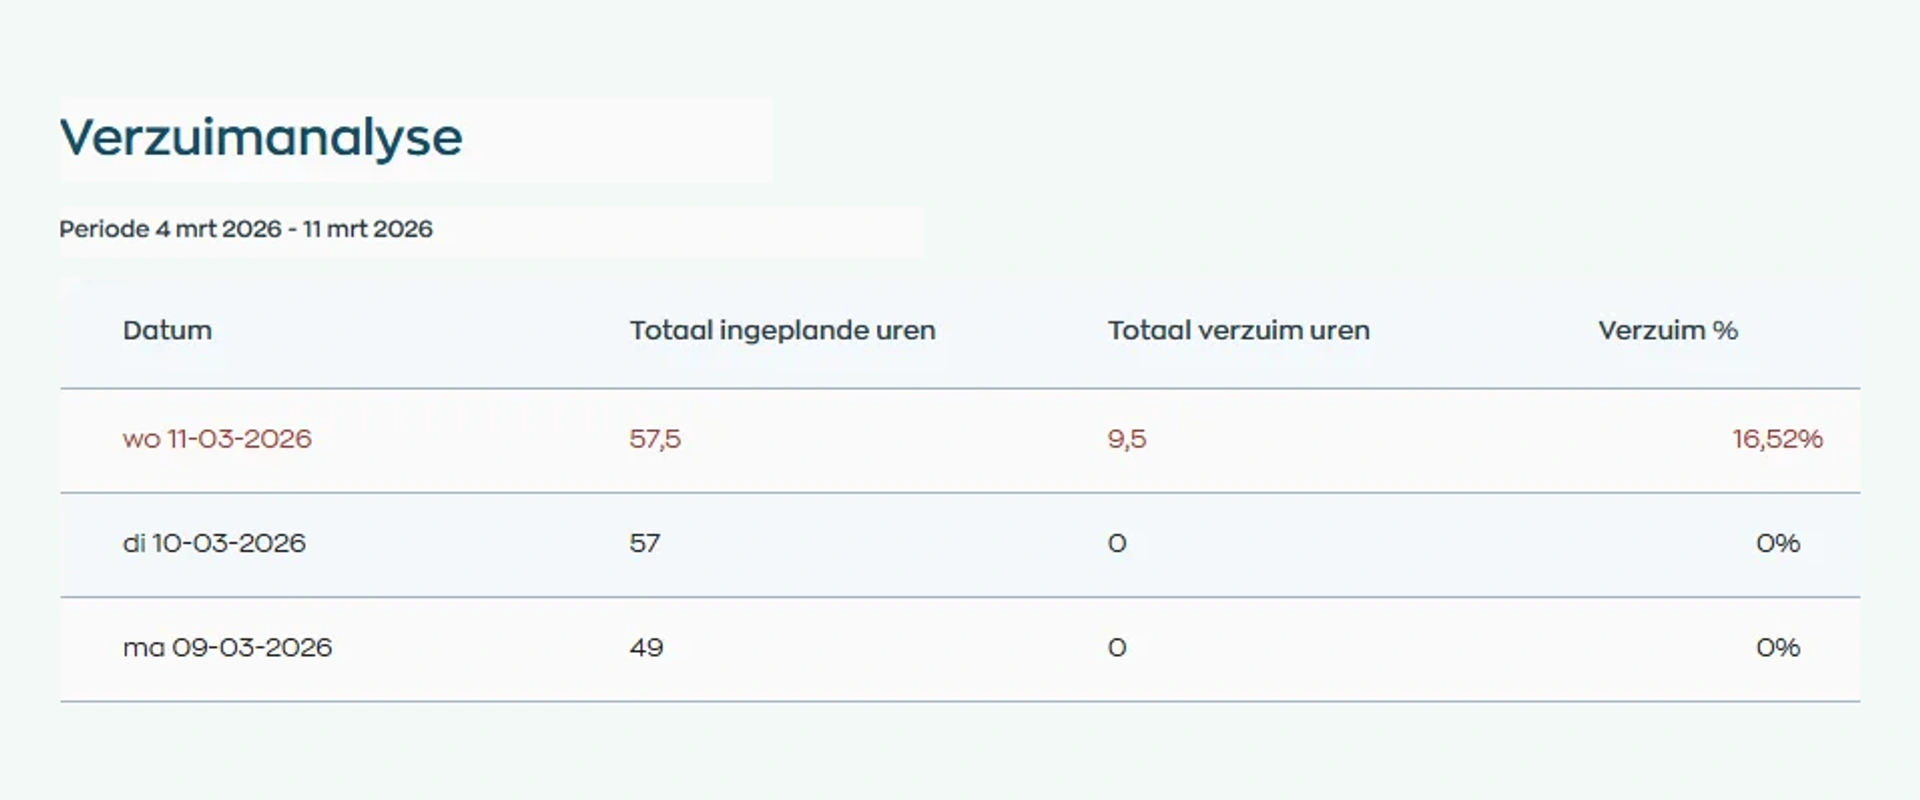
An absence rate means more when you can also see the scheduled hours, period and team. HR and managers review trends and daily figures to decide where a conversation or closer analysis is needed.
Compare teams, review absence duration and Dutch WvP follow-up indicators, and explore the daily breakdown. The calculation is based on scheduled hours. Export the selected period to CSV for your own analysis, while managing employee support in Absence Management.
3. Follow learning progress
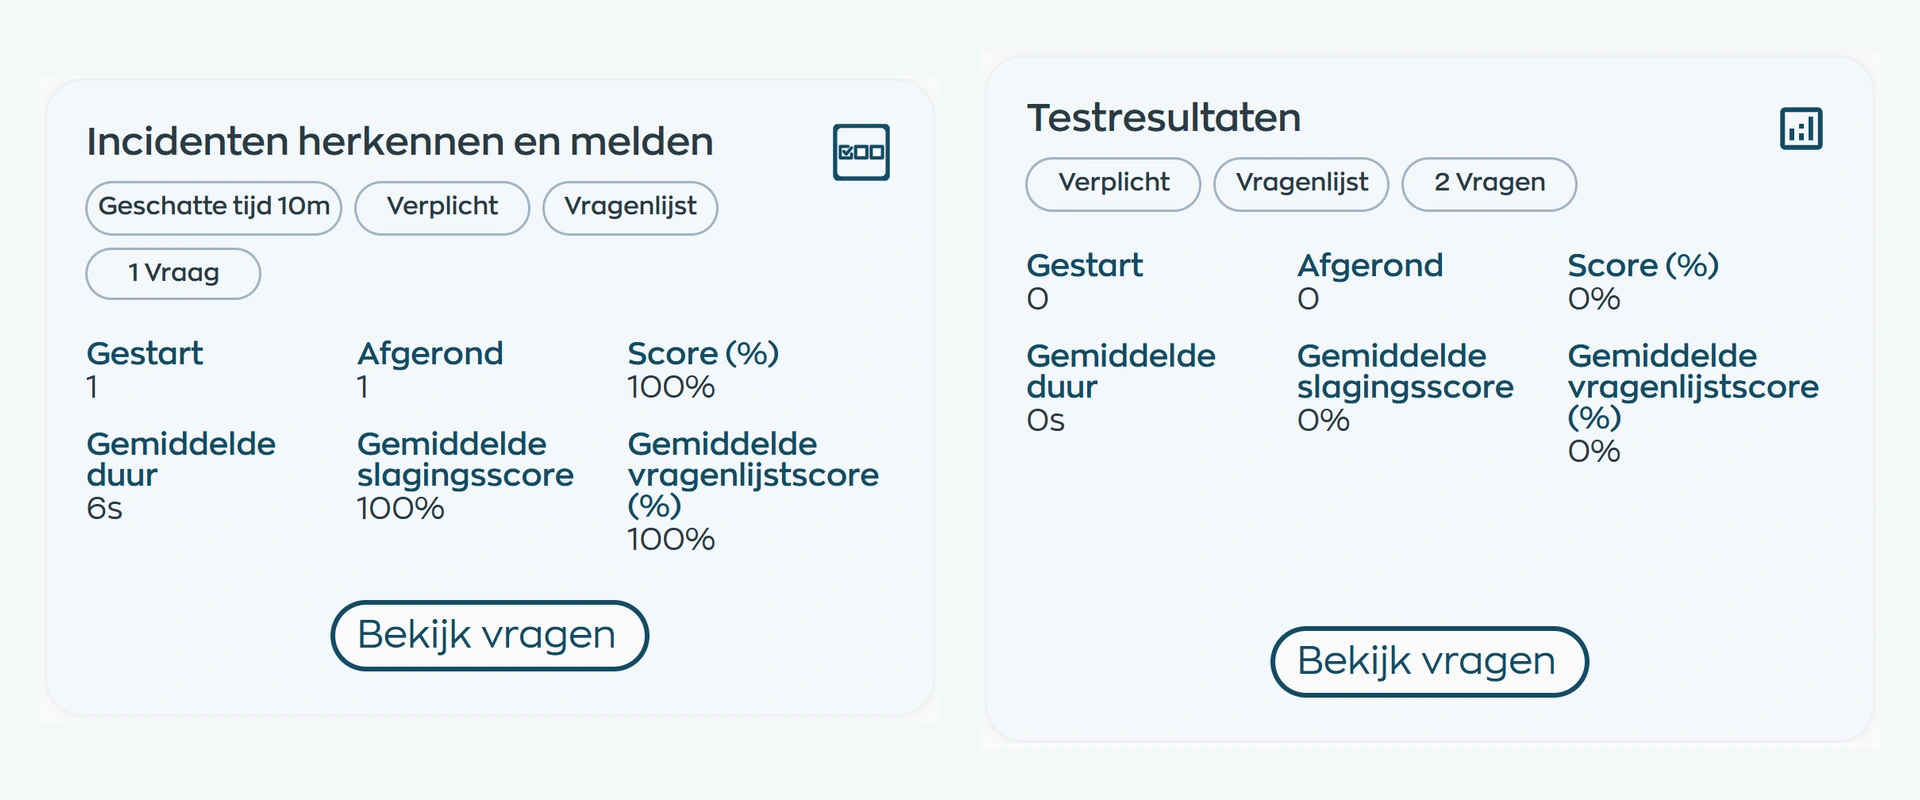
Assigning a course is only the start. The training coordinator can see who has begun, who has finished and which modules remain. That makes it easier to help employees complete their learning path.
Training & Development also shows scores, time spent and answers to individual questions. Alongside participation and results, this helps you discuss difficult topics or improve the course content.
4. Include the employee perspective
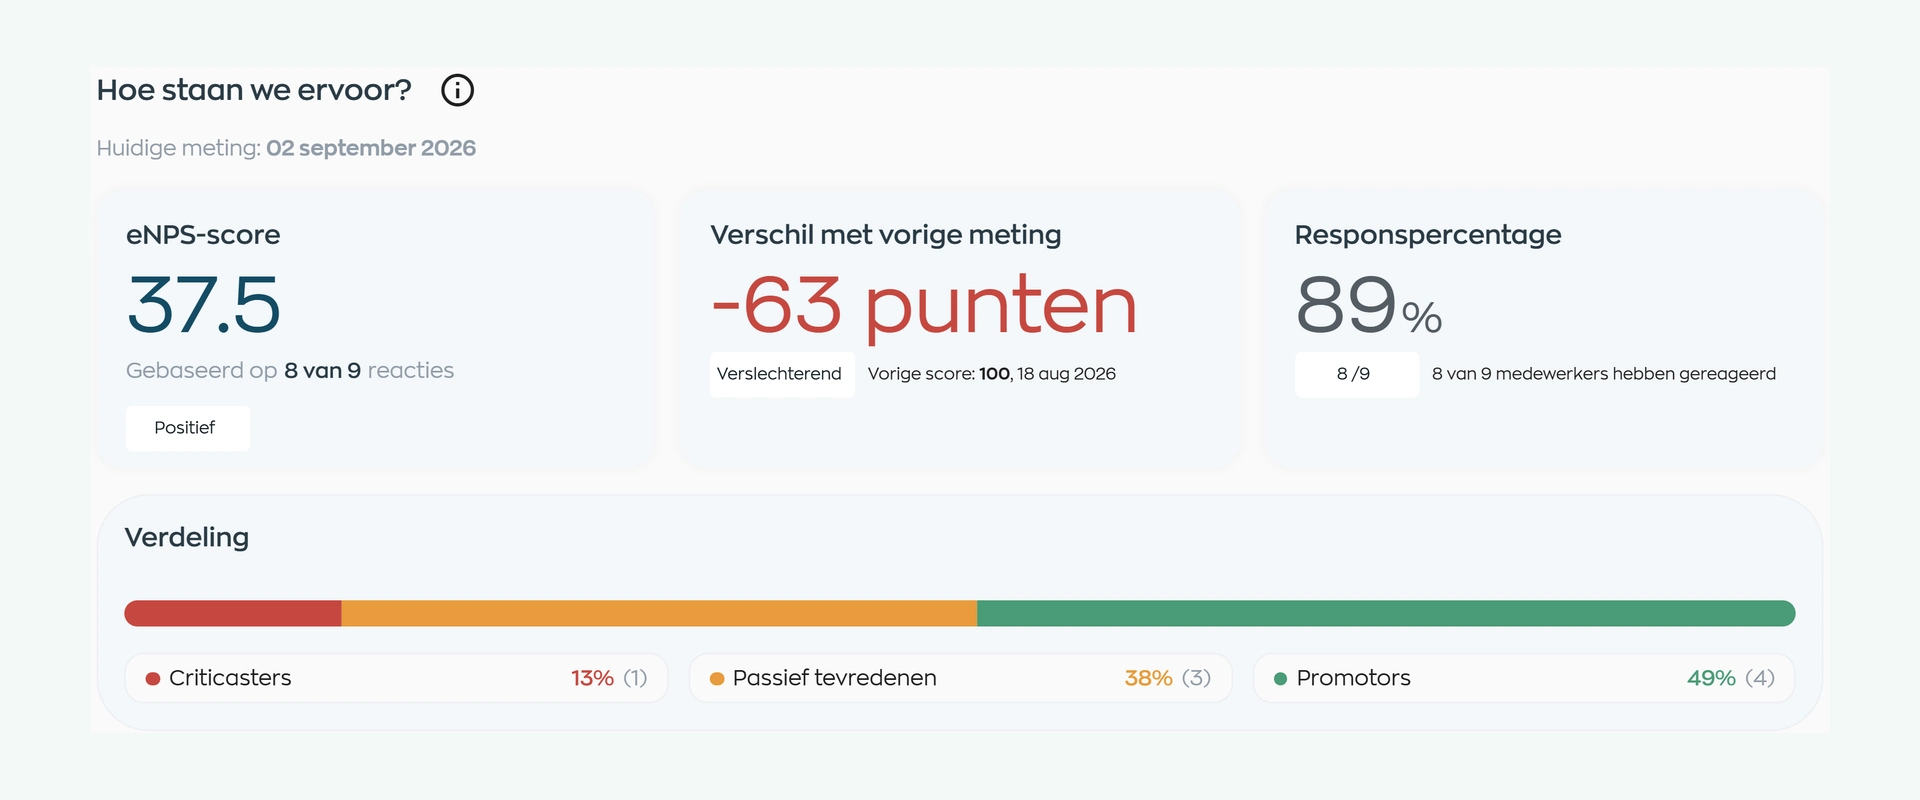
Hours, absence and learning results do not explain how employees experience their work. Review eNPS, Pulse and survey results in Insights alongside them. Consider participation, the distribution of answers and earlier results before drawing conclusions.
HR and managers discuss what stands out and what to do next. A positive eNPS is not necessarily an improvement: the comparison may be a reason to ask more questions. Record agreed actions and let employees know what happens next.
5. Keep everyday priorities in view
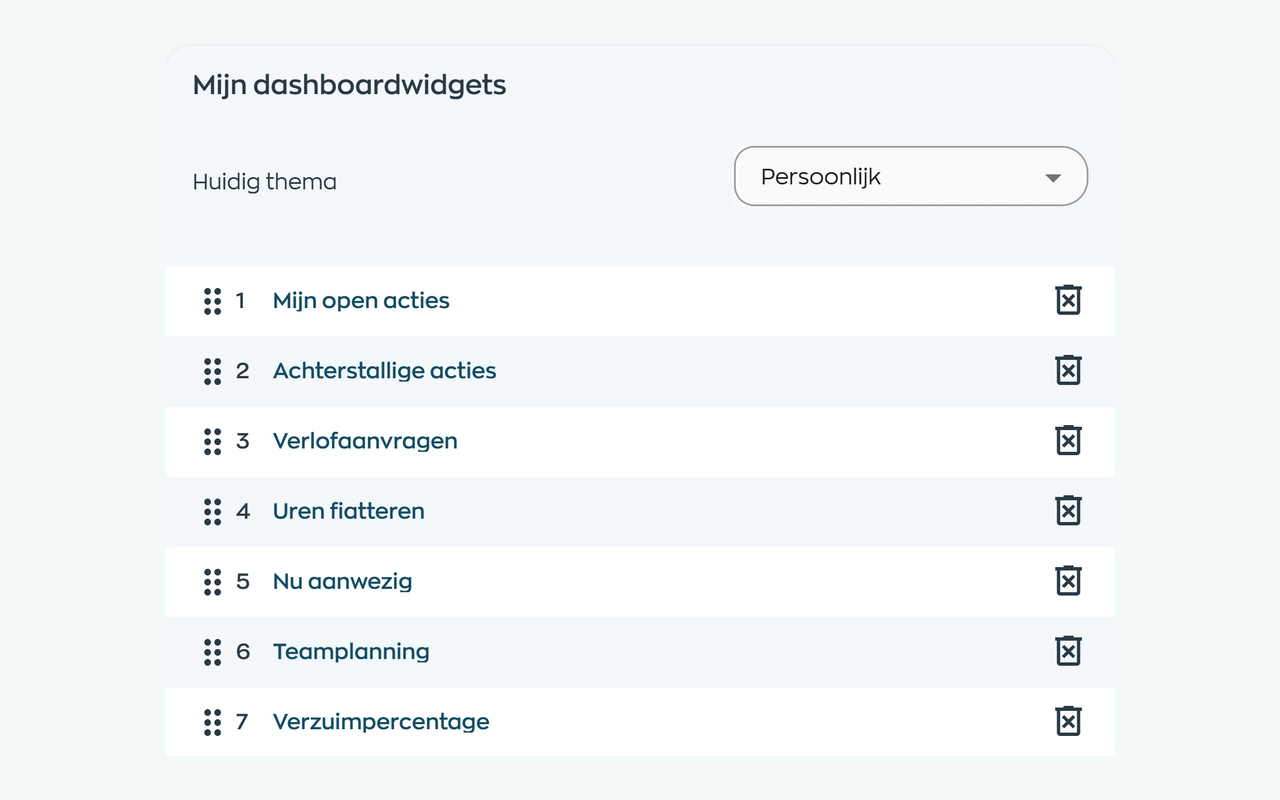
Not every question needs a detailed report. Set up your Office home screen with relevant widgets, such as open actions, hours awaiting approval, team planning, absence and learning progress. Open the related area straight from a widget.
The widget library and dashboard themes provide a starting point for different roles. Where your organization allows it, choose and arrange the available widgets yourself. Information remains subject to your existing permissions and team access.
What changes
HR keeps the wider picture in view, managers discuss what needs attention and training coordinators help employees move forward.
Discuss differences in hours, absence and development with your team. Use the dashboard for everyday priorities and reports to explore the detail.
Use a consistent period and selection, check the underlying records and export hours or absence data for further analysis or handover.
See where employees are in their learning path and which questions need attention. Discuss progress with the employee and their manager.
Is this right for your organization?
Whether you have one team or several locations, it helps when records, development and feedback stay connected.
Capabilities
Use work-related data, learning results and employee feedback within one platform. Each area provides the relevant filters, details and next steps.
Frequently asked questions
Practical answers about available reports, calculations and how your organization can use them.
In Office, Reports contains working hours and absence reports. Training & Development shows participation, progress and learning results. Insights contains eNPS, Pulse and employee survey results. Your personal dashboard brings together the available everyday widgets.
For hours and absence, choose a date range and select one or more employees or teams. The hours report also includes summaries by employee, work schedule and location. You can use the same selection for checking the figures and discussing them.
You can view the hours report as a table in WorkVine or download an XLSX file for Excel. Absence reports export to CSV. The export follows your selection; only share the information the recipient needs.
The calculation uses scheduled hours: it compares absent hours with the hours employees were scheduled to work. Always check the period and selected employees or teams. Daily figures and reports may refresh at different times, and corrections can appear after processing.
You can see assigned, started, completed and failed courses. For each course module, review progress, scores, duration and answers. This shows learning results and topics that need further explanation, as well as participation.
The organization determines which widget library and dashboard themes are available. If a personal layout is allowed, users can add, remove and arrange available widgets. This does not change their existing permissions or team access.
Reports helps you review and discuss work-related data, such as hours, absence and learning results. Insights focuses on employee experience through eNPS, Pulse and surveys. Use both perspectives together: a figure or a change is a starting point for investigation and conversation, not an explanation in itself.
Where work, people and growth come together
Bring a report you currently put together from separate spreadsheets. We will show you how to review hours, absence or learning results in WorkVine and connect that information with your everyday work.